Note
Go to the end to download the full example code.
Compare CDist with scipy
The following example focuses on one particular operator, CDist and compares its execution time between onnxruntime and scipy.
ONNX Graph with CDist
cdist function computes pairwise distances.
from pprint import pprint
from timeit import Timer
import numpy as np
from scipy.spatial.distance import cdist
from tqdm import tqdm
from pandas import DataFrame
import onnx
import onnxruntime as rt
from onnxruntime import InferenceSession
import skl2onnx
from skl2onnx.algebra.custom_ops import OnnxCDist
from skl2onnx.common.data_types import FloatTensorType

X = np.ones((2, 4), dtype=np.float32)
Y = np.ones((3, 4), dtype=np.float32)
Y *= 2
print(cdist(X, Y, metric="euclidean"))
[[2. 2. 2.]
 [2. 2. 2.]]
ONNX
ir_version: 10
producer_name: "skl2onnx"
producer_version: "1.20.0"
domain: "ai.onnx"
model_version: 0
graph {
  node {
    input: "X"
    input: "Y"
    output: "Z"
    name: "CD_CDist"
    op_type: "CDist"
    attribute {
      name: "metric"
      s: "euclidean"
      type: STRING
    }
    domain: "com.microsoft"
  }
  name: "OnnxCDist"
  input {
    name: "X"
    type {
      tensor_type {
        elem_type: 1
        shape {
          dim {
          }
          dim {
            dim_value: 4
          }
        }
      }
    }
  }
  input {
    name: "Y"
    type {
      tensor_type {
        elem_type: 1
        shape {
          dim {
          }
          dim {
            dim_value: 4
          }
        }
      }
    }
  }
  output {
    name: "Z"
    type {
      tensor_type {
        elem_type: 1
      }
    }
  }
}
opset_import {
  domain: "com.microsoft"
  version: 1
}
opset_import {
  domain: ""
  version: 22
}
CDist and onnxruntime
We compute the output of CDist operator with onnxruntime.
[array([[2., 2., 2.],
       [2., 2., 2.]], dtype=float32)]
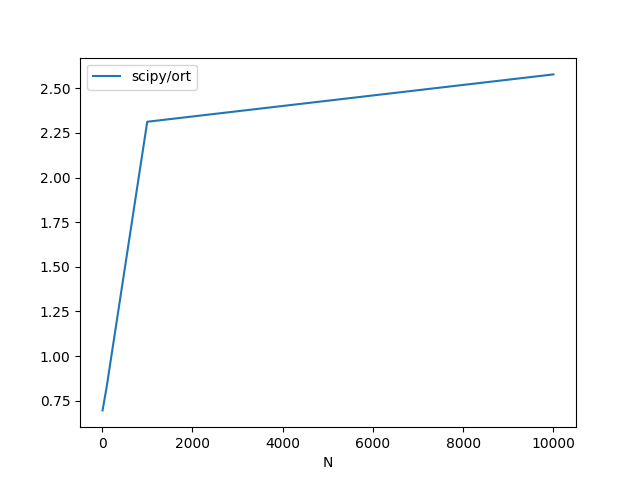
Benchmark
Let’s compare onnxruntime and scipy.
def measure_time(name, stmt, context, repeat=100, number=20):
    tim = Timer(stmt, globals=context)
    res = np.array(tim.repeat(repeat=repeat, number=number))
    res /= number
    mean = np.mean(res)
    dev = np.mean(res**2)
    dev = (dev - mean**2) ** 0.5
    return dict(
        average=mean,
        deviation=dev,
        min_exec=np.min(res),
        max_exec=np.max(res),
        repeat=repeat,
        number=number,
        nrows=context["X"].shape[0],
        ncols=context["Y"].shape[1],
        name=name,
    )
scipy
time_scipy = measure_time(
    "scipy", "cdist(X, Y)", context={"cdist": cdist, "X": X, "Y": Y}
)
pprint(time_scipy)
{'average': np.float64(8.388408499740761e-06),
 'deviation': np.float64(1.6189856582890656e-06),
 'max_exec': np.float64(1.6290050189127216e-05),
 'min_exec': np.float64(5.42800007679034e-06),
 'name': 'scipy',
 'ncols': 4,
 'nrows': 2,
 'number': 20,
 'repeat': 100}
onnxruntime
{'average': np.float64(2.2734084515832364e-05),
 'deviation': np.float64(7.742288389568214e-06),
 'max_exec': np.float64(6.692659990221727e-05),
 'min_exec': np.float64(1.1446249845903367e-05),
 'name': 'ort',
 'ncols': 4,
 'nrows': 2,
 'number': 20,
 'repeat': 100}
Longer benchmark
metrics = []
for dim in tqdm([10, 100, 1000, 10000]):
    # We cannot change the number of column otherwise
    # we need to create a new graph.
    X = np.random.randn(dim, 4).astype(np.float32)
    Y = np.random.randn(10, 4).astype(np.float32)

    time_scipy = measure_time(
        "scipy", "cdist(X, Y)", context={"cdist": cdist, "X": X, "Y": Y}
    )
    time_ort = measure_time(
        "ort",
        "sess.run(None, {'X': X, 'Y': Y})",
        context={"sess": sess, "X": X, "Y": Y},
    )
    metric = dict(N=dim, scipy=time_scipy["average"], ort=time_ort["average"])
    metrics.append(metric)

df = DataFrame(metrics)
df["scipy/ort"] = df["scipy"] / df["ort"]
print(df)

df.plot(x="N", y=["scipy/ort"])
  0%|          | 0/4 [00:00<?, ?it/s]
 75%|███████▌  | 3/4 [00:00<00:00, 12.77it/s]
100%|██████████| 4/4 [00:01<00:00,  2.78it/s]
       N     scipy       ort  scipy/ort
0     10  0.000008  0.000010   0.784224
1    100  0.000009  0.000010   0.832827
2   1000  0.000062  0.000017   3.592265
3  10000  0.000488  0.000113   4.322265
Versions used for this example
print("numpy:", np.__version__)
print("onnx: ", onnx.__version__)
print("onnxruntime: ", rt.__version__)
print("skl2onnx: ", skl2onnx.__version__)
numpy: 2.4.1
onnx:  1.21.0
onnxruntime:  1.24.0
skl2onnx:  1.20.0
Total running time of the script: (0 minutes 1.626 seconds)